
In the fast-paced world of trading, staying ahead of the competition is crucial. Traders are constantly looking for innovative tools and strategies to gain an edge in the market. One such tool that has gained popularity among experienced traders is Cumulative Delta (CD), also known as Cumulative Volume Delta (CVD). This powerful concept allows traders to analyze market order flow and make informed decisions. In this article, we will explore what Cumulative Delta is, how it works, and how it can be used to improve trading strategies. So, buckle up and get ready to dive into the fascinating world of Cumulative Delta.
Understand Cumulative Delta also known as Order flow
Before we look at cumulative delta, let's first understand the concept of order flow.
Let me give you an example:
Every time you buy with a market order, another real market participant sells with a limit order. There are always these two types of orders. An aggressive market order that executes immediately and a passive limit order. A stop order also becomes an aggressive market order when the stop price is reached.
You can see this for example in the Depth of Market (DOM).
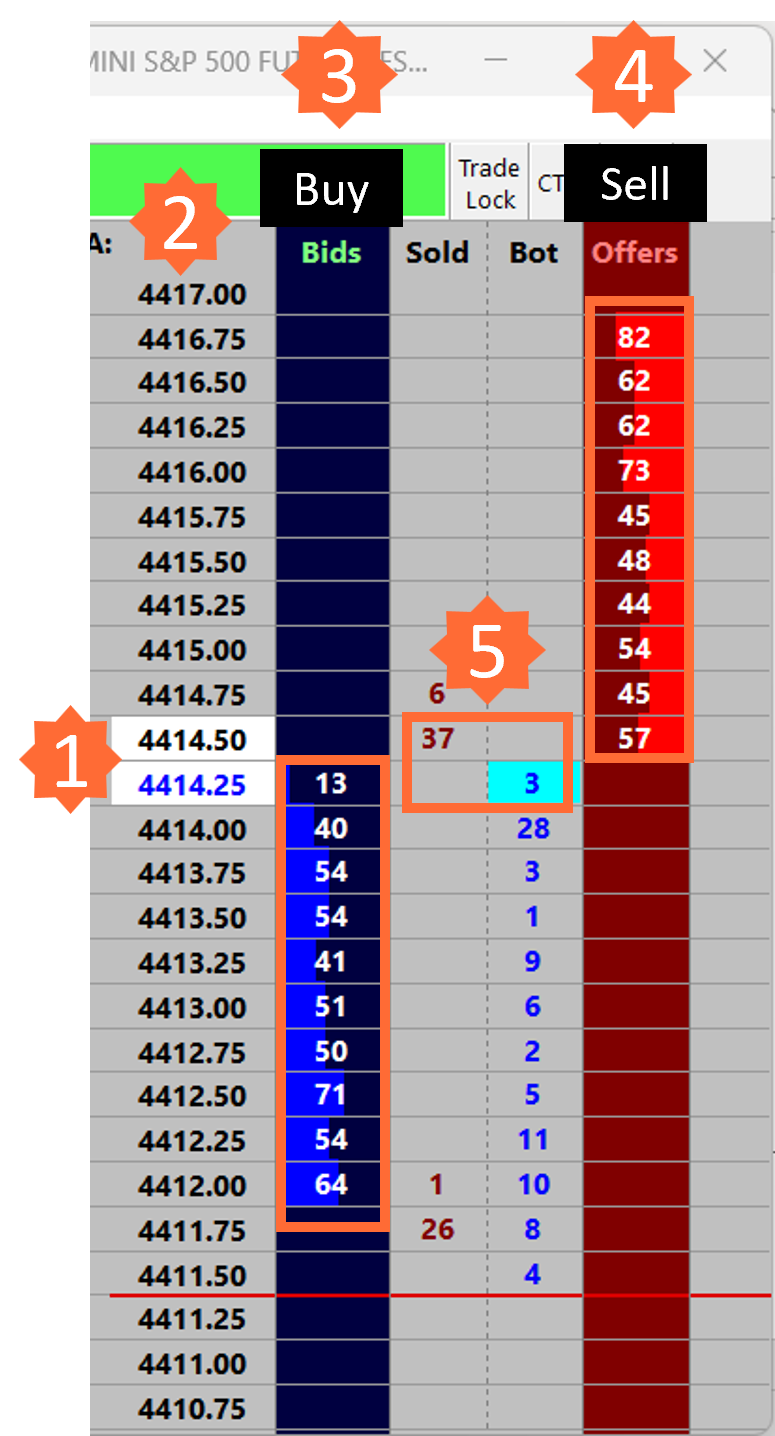
Current Market Price ➤ Buy (Bid) = 4414.25 / Sell (Offer) = 4414.50
Price latter
Buy (Bid) Pending Limit Orders to Buy
Sell (Offer) Pending Limit Orders to Sell
Amount of the last market orders at this price level
Order flow is the real-time data that represents the buying and selling activity in the market. It provides insight into the number of buyers and sellers (5), the volume of shares being traded, and the aggressiveness of market participants. By analyzing order flow, traders can identify trends, uncover hidden patterns and predict potential price movements.
Cumulative Delta aggregates market orders (aggressive buying or selling) and displays them on a graph. You can then use this graph to see how market participants are acting and compare it to current price movements.
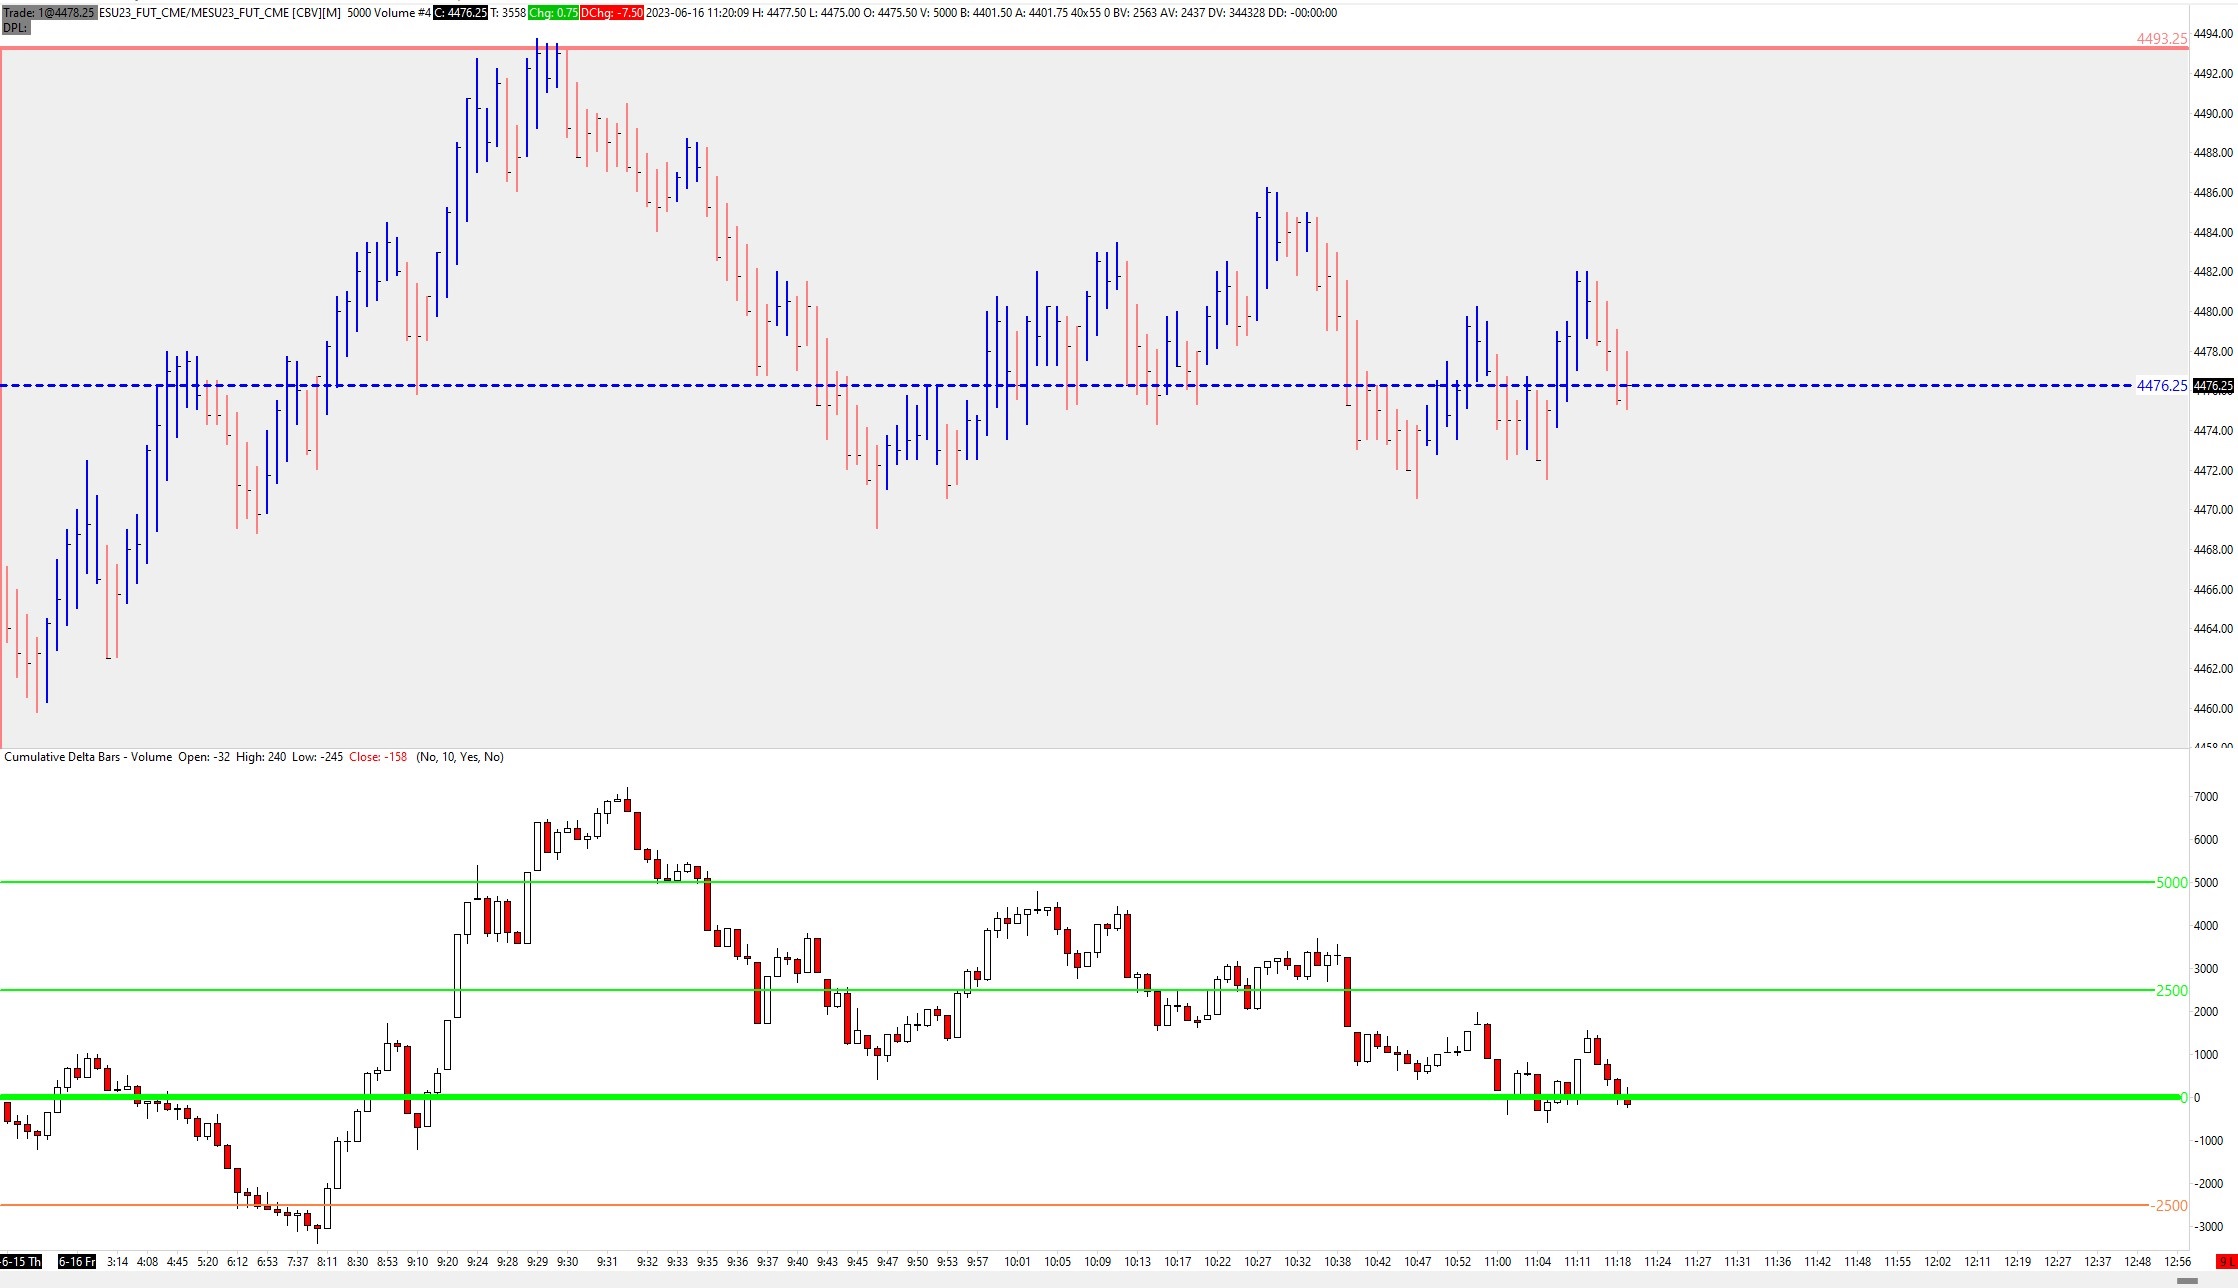
This continuous summation of the differences creates a cumulative delta chart that can provide valuable insight into market sentiment and potential price reversals. The next image shows the price of the S&P 500 futures contract in a 5000 volume candlestick chart and the cumulative delta chart below.
Cumulative Delta Indicator
There are many ways to display Cumulative Delta. But the main understanding should always be the same: Cumulative Delta is not an indicator. It is just raw data from market orders that sell or buy the underlying asset. Always keep this in mind when using Cumulative Delta as an indicator.
There are three main ways to display the Cumulative Delta indicator:
In the footprint chart
Below the price chart in single volume candlestick format, always starting from zero.
Below the price chart in the format of volume candles, starting from the close of the previous candle.
I prefer the third option, which prints the cumulative delta below the chart with the starting point of the new candle at the previous close. This makes it easier for me to read and interpret the cumulative delta in relation to the price.
Interpreting Cumulative Delta
Cumulative Delta charts start each new trading day at zero, so it is an indicator mainly used for intraday trading. I use the cumulative delta as a candlestick chart because you can see the buying or selling pressure (market orders) in each candlestick.
Generally speaking: When the Cumulative Delta is above the zero line, it indicates that buying pressure is predominant, which indicates bullish sentiment. Conversely, if the cumulative delta is below the zero line, it indicates selling pressure, indicating bearish sentiment. But be careful, this is not always correct and can mislead you.
Day traders often look for divergences between the price chart and the Cumulative Delta chart.
There can be three phases of price vs. cumulative delta:
The cumulative delta is in line with the price (e.g. higher highs, higher lows).
Cumulative delta is not in line with price, indicating lack of participation.
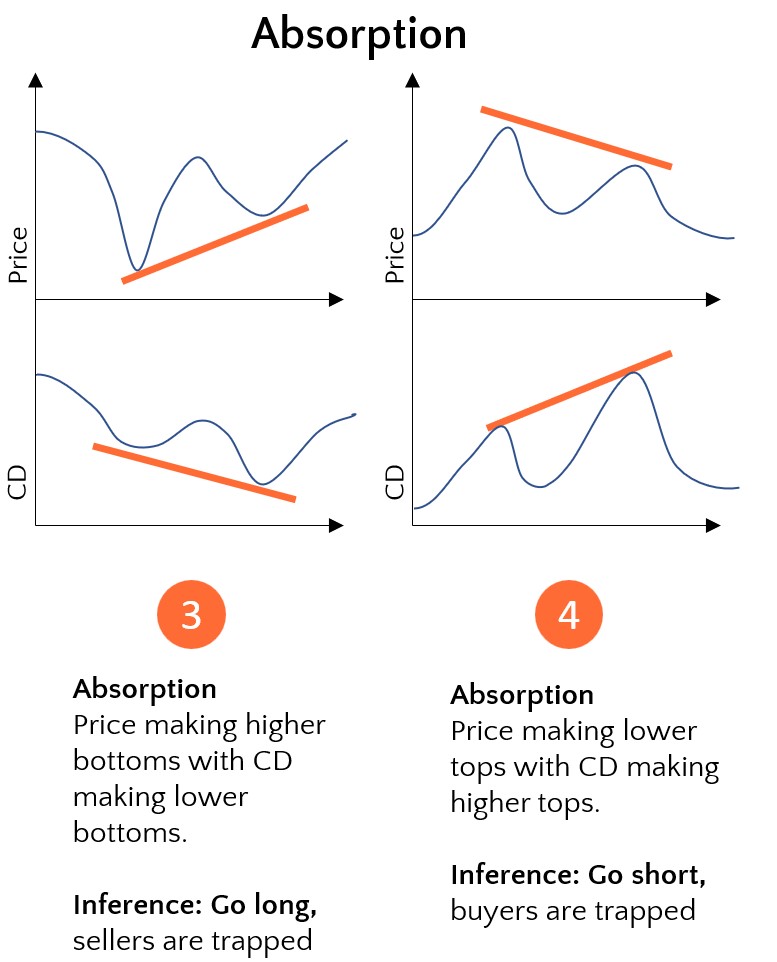
Cumulative delta is out of line with the price, indicating absorption.
Cumulative Delta Divergences
Let's break it down and visualize it. For each divergence there are two different versions.
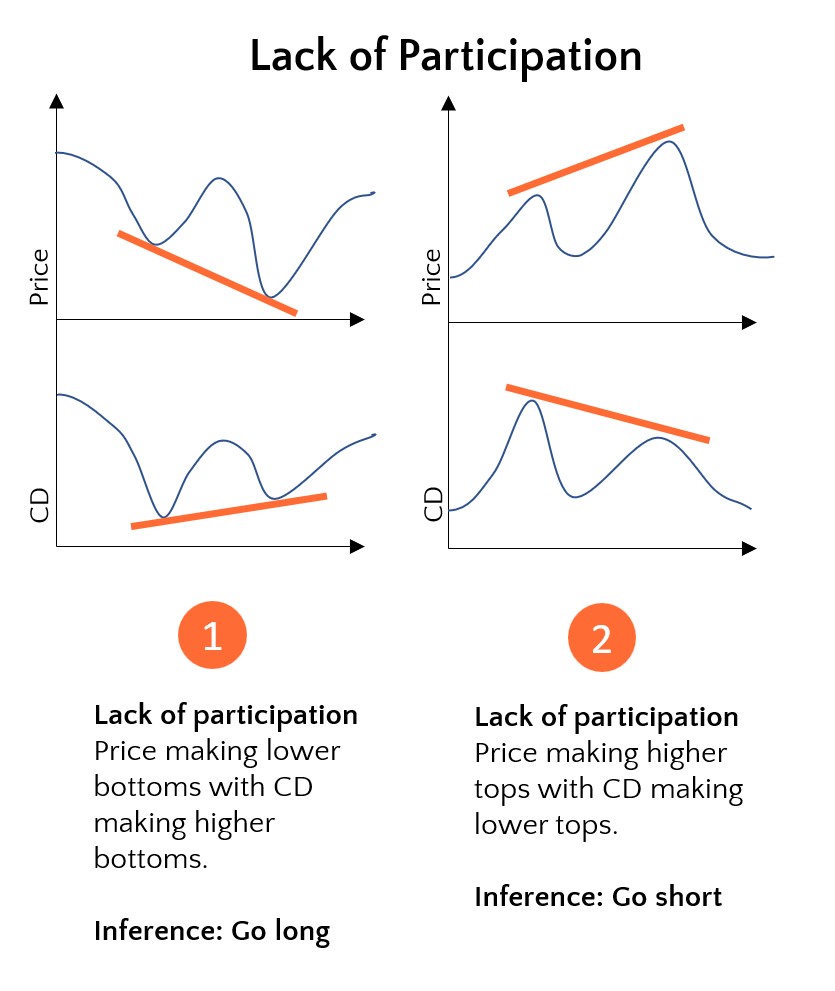
For example, (1) when the price is making lower lows, but the cumulative delta is making higher lows. This may indicate a lack of participation and a potential price reversal will be the start of an uptrend. Such divergences can act as early warning signals for traders.
With the Cumulative Delta you can also see absorption (3) and (4) in the market. Trading in line with absorption is a bit more difficult because there can be longer term or shorter term absorption. This makes it a bit more difficult to interpret and use for your correct timing. All of this requires a lot of experience that can only be gained through trading practice.
Let's continue with a real life example where you can see the lack of participation.
In the next picture you can see in section (1) that the Cumulative Delta did not follow the price at all. Price was making higher lows, but CD was making lower lows, a clear absorption of the sellers.
At some point the sellers realized that there was more pressure to the upside and they had to buy back their short positions. This is perfect timing for a long trade.
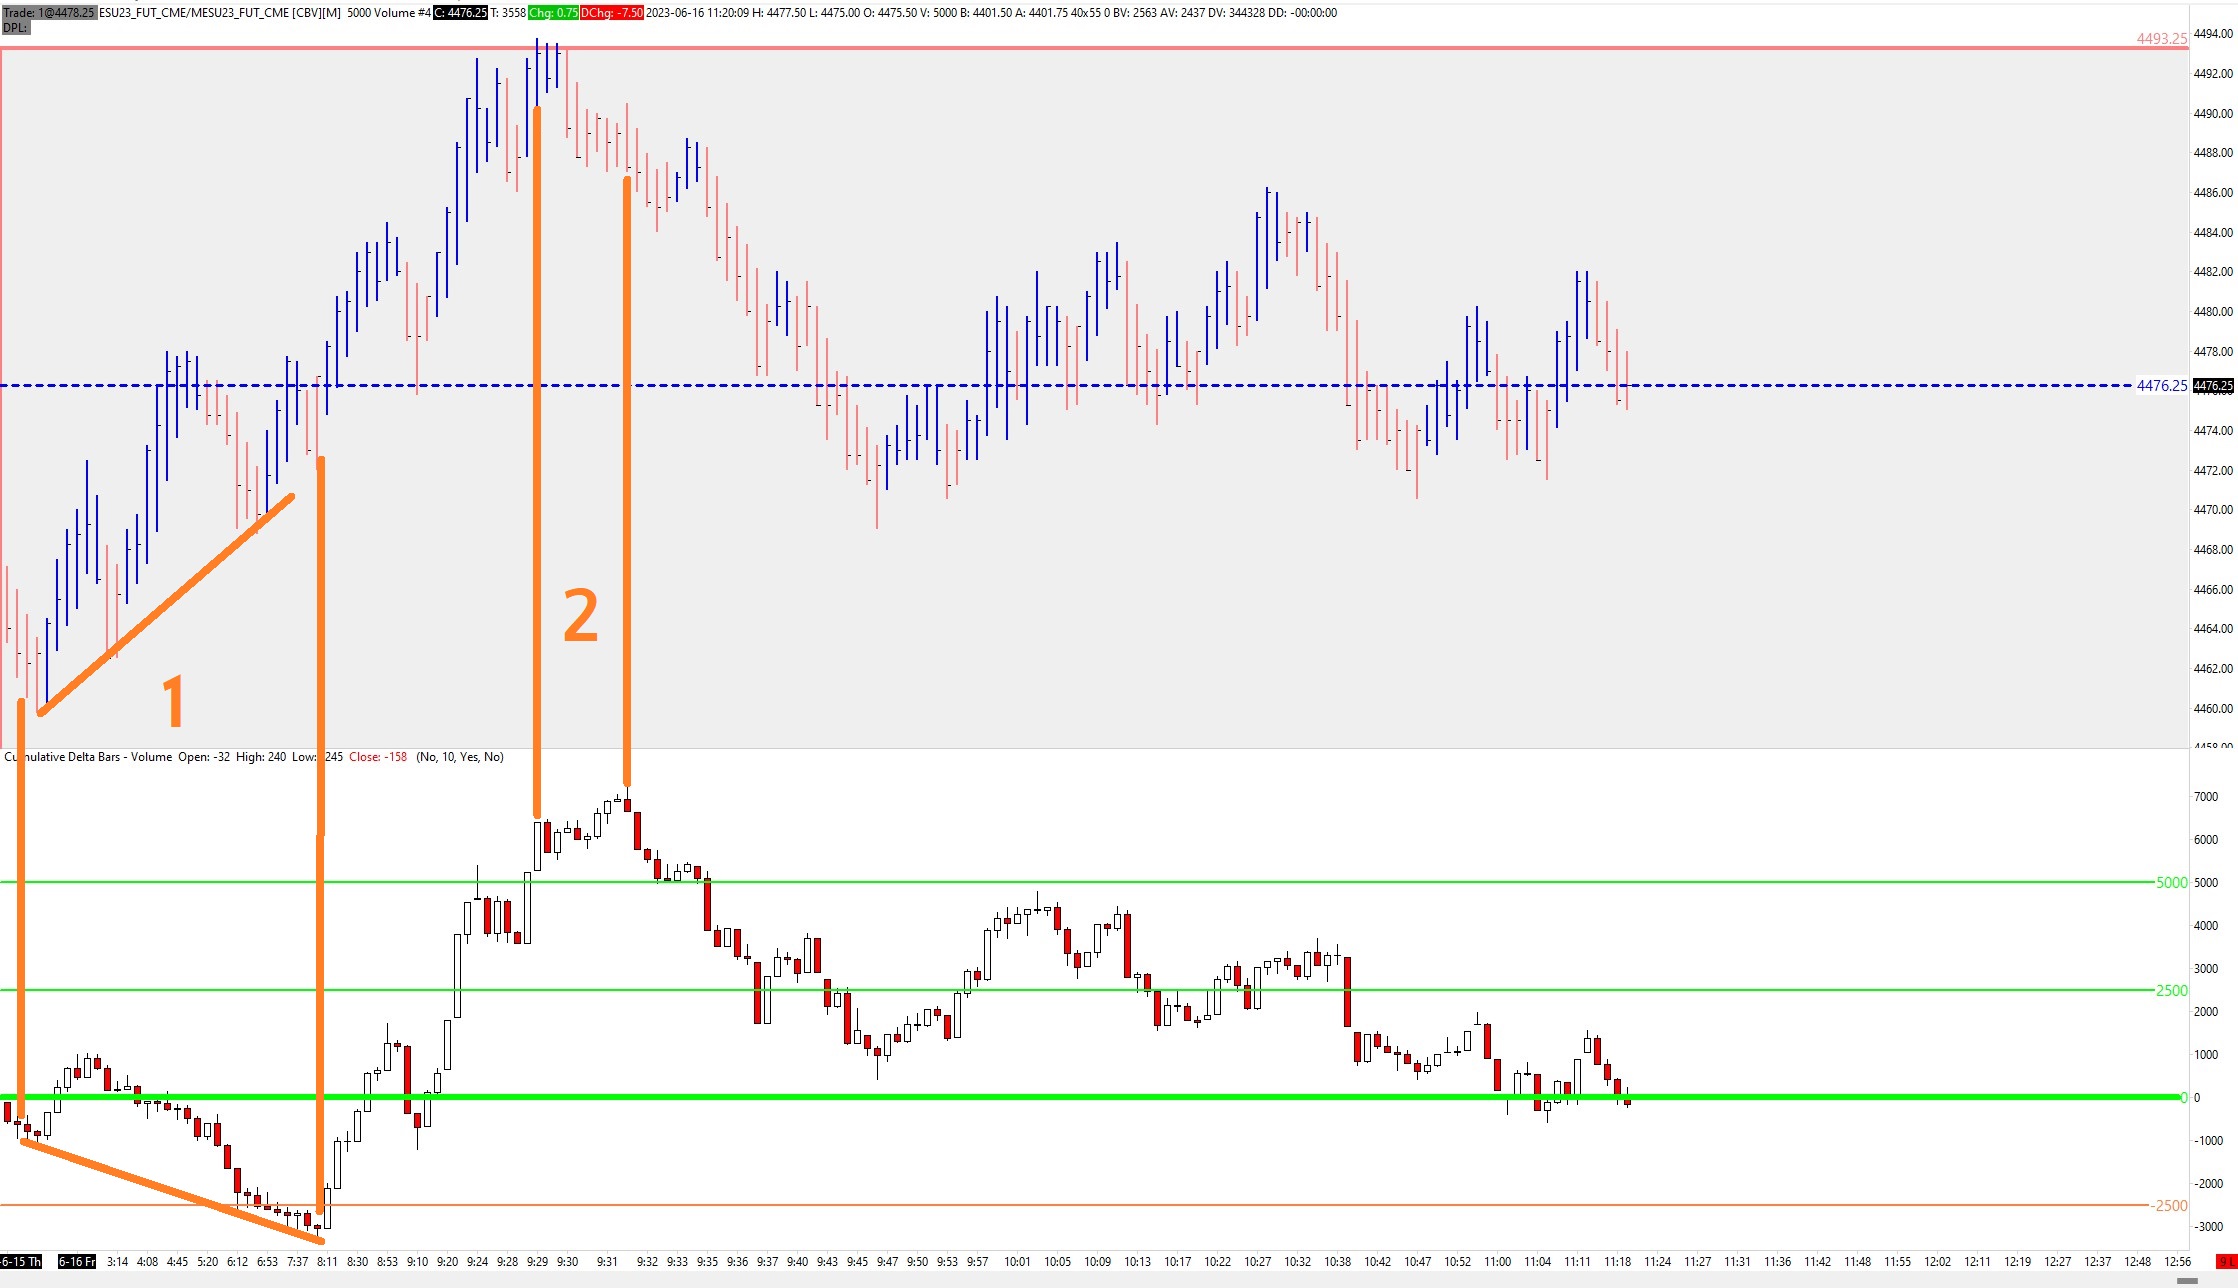
In the next phase, at the beginning of (2), the price hit a resistance level. Shortly thereafter, the price went down, but the cumulative delta still went up, so the buyers were absorbed. Soon after, they realized that they were trapped and closed their long positions. The price went down. A perfect scenario for a short trade.
Cumulative Delta as part of a day trading strategy
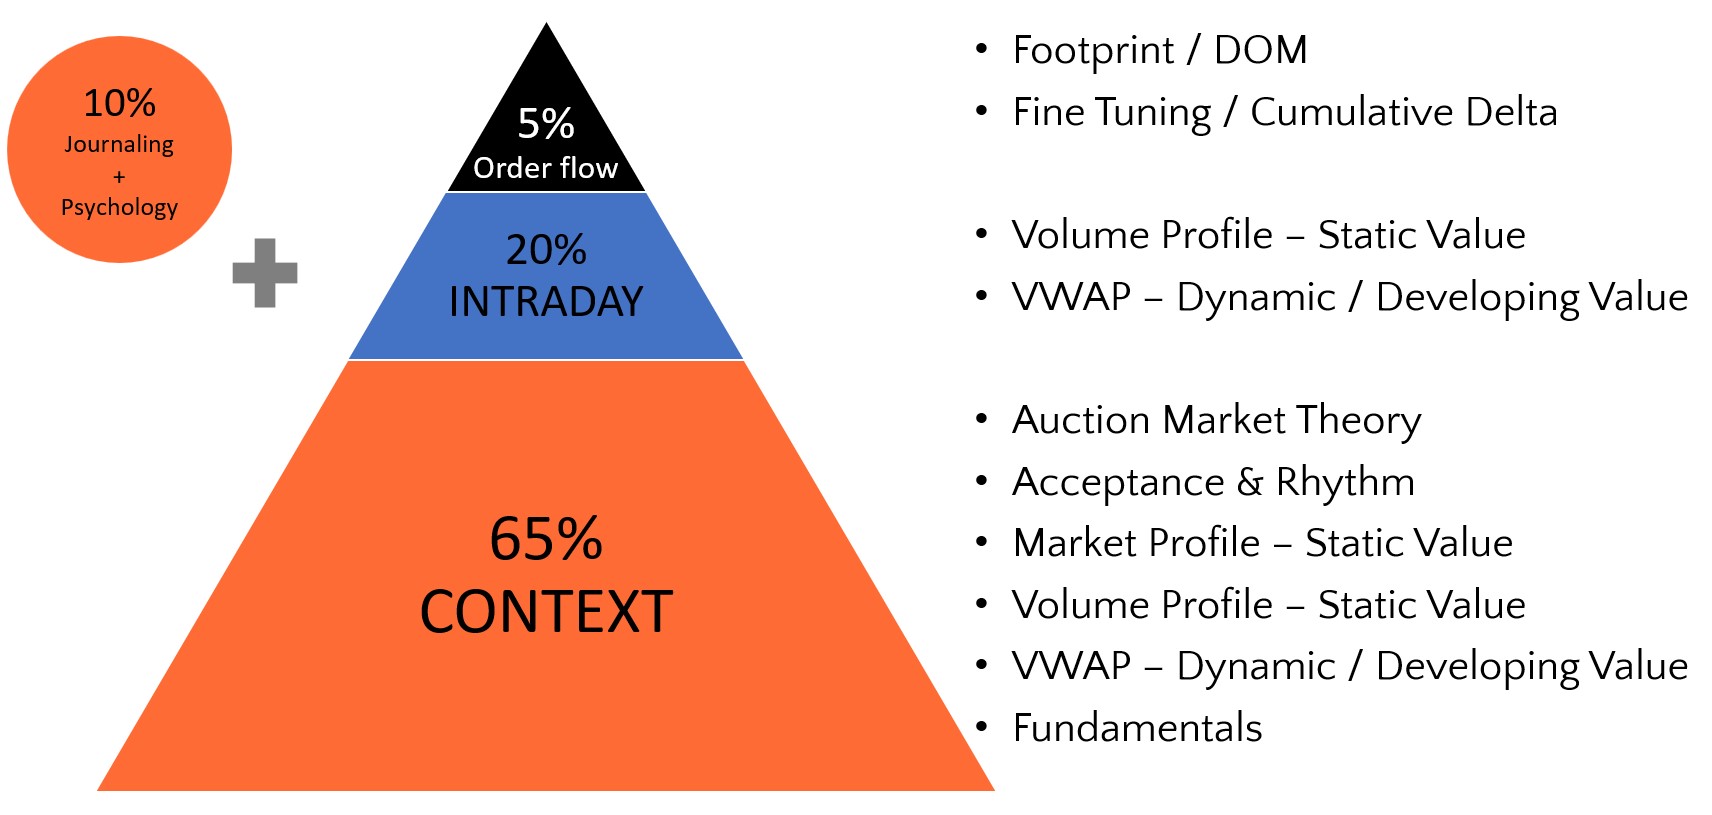
Of course, these are only examples of how to use Cumulative Delta for your day trading. The analysis works best when you also consider the overall trading context and market rhythm. In my opinion, this is the foundation of any trading setup and the key to a long and successful day trading strategy. This will make it easier to see the right things and minimize the number of losing trades.
The foundation of my day trading strategy is a complete contextual analysis taking into account many different things as shown in my day trading strategy pyramid. There you can see that the Cumulative Delta analysis is only the small top of the pyramid. I only use the order flow analysis to fine tune my trade entries and exits. It is perfect for that and I love it, but you always have to keep in mind that this analysis should only play a minor role in your trading strategy and other things like context analysis, value areas or acceptance and market rhythm are much more important.
With Cumulative Delta analysis it is possible to have an edge over other market participants especially for these 4 points:
Identifying support and resistance levels
Confirming breakouts, including opening range breakouts
Scalping opportunities
Analyzing price reversals
Risk management and trade exit
Cumulative Delta on other Trading Platforms
Cumulative Delta MT4:
Many day traders use MetaTrader 4 (MT4) or MetaTrader 5 (MT5) for their day trading. It is one of the most popular trading platforms for trading FOREX, CFDs, Crypto and other trading products. There are thousands of free and paid indicators available and almost every introducing broker supports the platform. I checked some free indicators and did not find any MT4 indicator that shows the same cumulative delta data as my Sierra chart. I don't know the reason, but from my current point of view I cannot recommend any Cumulative Delta MT4 indicator.Cumulative Delta TradingView:
There are also some Cumulative Delta indicators available for TradingView. However, I checked all indicators and compared them with my Sierra chart and found significant differences in appearance. So from my current point of view I can't recommend any Cumulative Delta TradingView indicator.Cumulative Delta Sierra Chart:
I use Sierra Chart with Level 2 data for my day trading. Cumulative Delta is part of my daily analysis and I use it for trade confirmation and entry and exit timing. In my day trading course you can learn my complete day trading strategy and also get my cumulative delta indicator package.
Conclusion
Cumulative Delta is a powerful tool for day traders that allows them to unlock the valuable insights hidden in order flow data. By using Cumulative Delta to identify support and resistance levels, confirm breakouts, spot scalping opportunities, analyze reversal patterns, and manage risk, day traders can gain a competitive edge in the dynamic world of day trading.
Remember that mastering the Cumulative Delta requires practice, experience and a deep understanding of market dynamics. So arm yourself with knowledge and embark on your journey to successful day trading with Cumulative Delta as your trusted ally.
You will learn all this and much more in my professional day trading course.
Check it out now.