
Again, no profit.
Your money is gone. Everyone applauded the trend. Instead, after you invested, prices fell. You hang your head in frustration.
The inloopo stock market indicator protects you from such situations. It shows you when to be invested and when to hold cash. Even before the news reports about it.
No more worrying that prices will rise again soon. No more hassle because you lost a lot of money.
Rather.
Be invested safely. Get out before a crash. Continuously increase money.
The inloopo stock market indicator
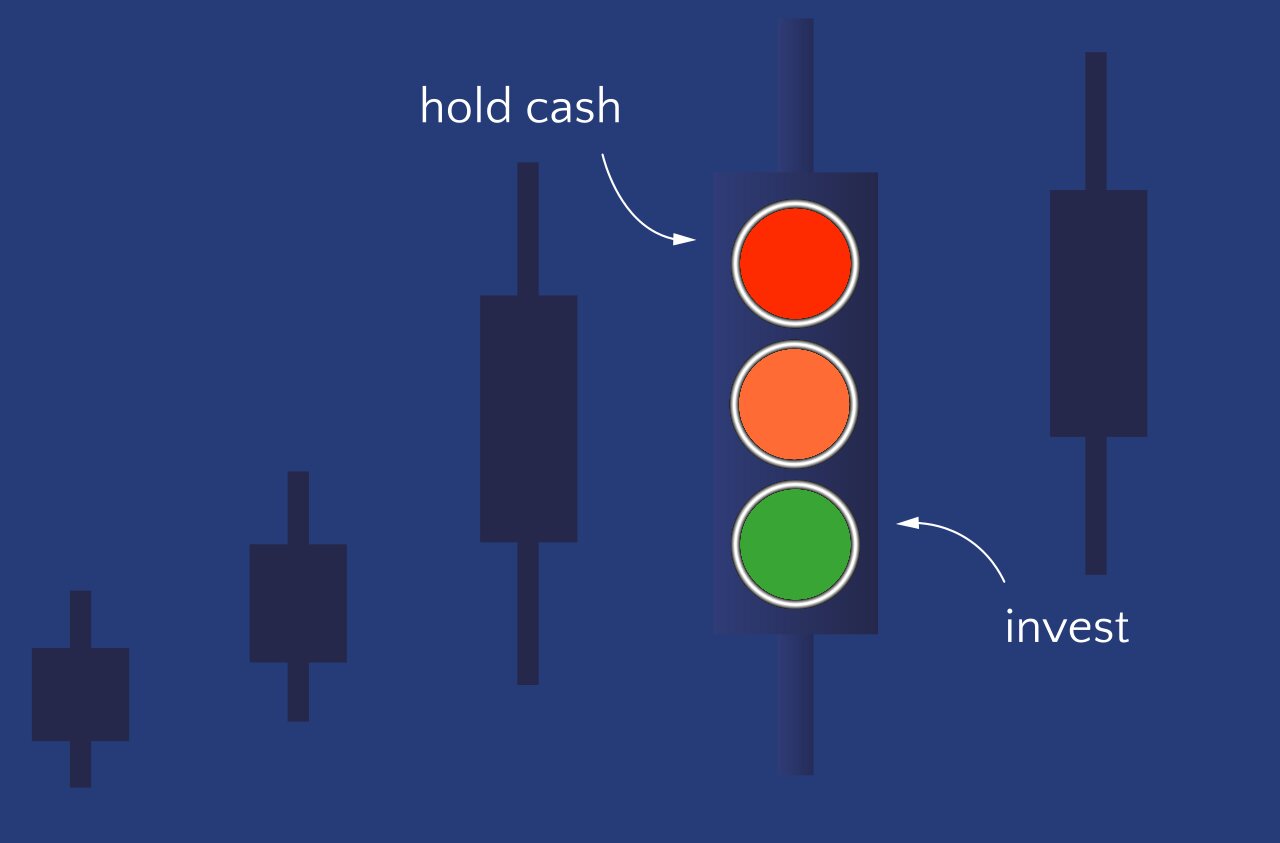
The inloopo stock market indicator is based on a fundamental analysis and various indicators. A hybrid system that will help you beat the market. It signals this using the classic colors of a traffic light - green, yellow, and red.
It combines the classic chart and momentum analysis with the fundamental analysis of the markets. This has the advantage that there are signs of a trend reversal even before they are reflected in the price.
In this respect, the inloopo stock exchange traffic light is superior to other stock exchange traffic lights and barometers that are only based on price-based indicators.
Warning signs must be correctly interpreted and classified. This requires knowledge, experience, and passion. I accept this challenge. For those trying to learn these skills, the traffic light colors clearly signal when you prefer to keep your money with you.
Fundamental analysis includes:
COT data
VIX futures structure curve
POIV Indicator (Price, Open Interest and Trading Volume)
Sentiment (currently in the test phase)
Seasonal trend (currently in test phase)
Classic chart analysis includes:
52 Moving Average (weekly chart)
Trend analysis
Momentum Indicator
Divergences (Momentum, POIV, ProGo)
Advantages
Faster than the news.
The inloopo stock market indicator can signal entries and exits through its structure, even before the market moves in a certain direction.
You know what happens in the markets, even before it's in the news, because you use a traffic light instead of the news as a source of information. For example, the financial news only reports on a stock market rally when it is well under way, and only on the crash when it is long overdue. Therefore, news cannot be used as a traffic light or direction indicator.
Not much to do
There are only a few transactions per year. A total of 38 trades were executed in 24 years (1998 - 2022).
Plannable
You can plan all actions during the weekend.
For everyone
No matter whether you are employed, already enjoying your pension, or just starting to invest, you can use the inloopo stock exchange light successfully. You can start with a lot or a little capital.
Few losing streaks
There is a very low maximum drawdown. Therefore, the implementation is also particularly suitable for investors with an investment horizon of less than 5 years, such as retirees.
With the trend
If a trend develops, there is a buy signal.
Crash warning
Everyone else takes the crash with them. Not you. Because the inloopo stock exchange traffic light warns you in good time before the next stock market crash.
Disadvantages
In sideways markets it is very difficult to beat the index (see the performance from August 2014 to December 2016)
The outperformance to the index comes mainly from holding 100% cash in the big and long stock market crashes.
Fundamental Analysis
The COT data
COT data from the Commitment of Traders Report (COT Report) is released in tabular format each Friday after market close by the Commodity Futures Trading Commission (CFTC). There are tools that show all COT data - since the beginning of the first publication - as a graph. This is the easiest way to compare and evaluate them.
If you want to learn more about the COT data, you will find a free course with 16 videos at InsiderWeek, in which the COT report is also explained in detail.
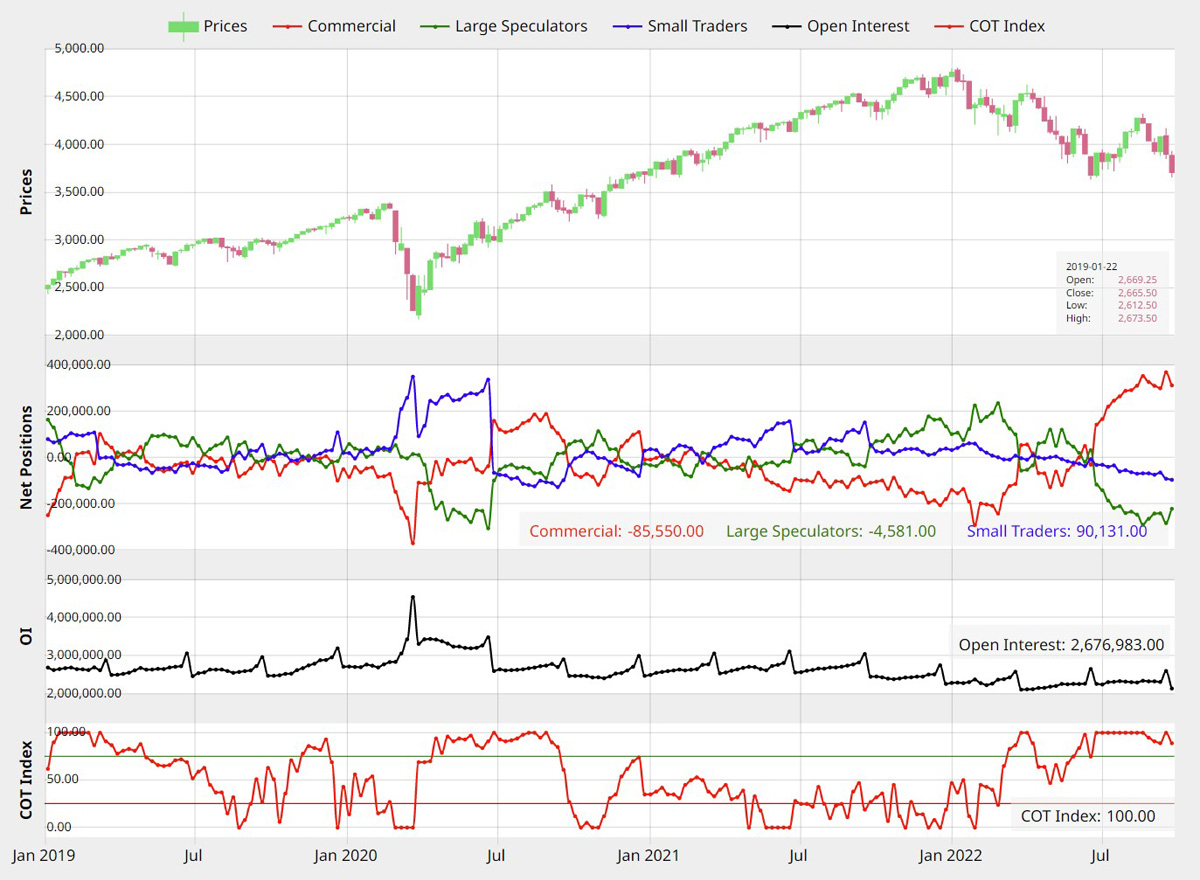
The figure shows you an excerpt from InsiderWeek's COT tool using the example of the S&P 500 index in the weekly chart.
Info
Who is a commercial market participant and large speculator in the S&P 500 stock market index?
The commercials or commercial market participants for the S&P 500 Index are the large pension funds and insurance companies in the USA.
For the S&P 500 Index, the large speculators are the banks or large traders who are above the reporting limit. Anyone who trades more than 1000 futures contracts in the S&P 500 is required to report and is sorted into one of the two categories.
All market participants trading fewer than 1000 futures contracts are non-reportable small speculators like you and me. 😊
Since the COT data is only published on a weekly basis, the analysis for the traffic light takes place on the weekly chart and not on the minute or daily chart. For the inloopo stock exchange traffic light, I evaluate the net positions of the commercials and use the COT index on different time frames.
In my analysis, I pay attention to COT buy signals. These arise when the COT Index value is above 75 and occurs in conjunction with a positive weekly candle. A COT sell signal occurs when the COT Index value falls below 25 and coincides with a negative weekly candle. The resulting signals serve as a fundamental analysis and are a first indicator of a bottom formation after a crash.
The advantage of this indicator is that it is not derived from the price of the index, but from the positioning of the major players in the market, whose size can influence prices.
You can see that the two rallies in 2019 and 2020 were well indicated by the COT buy signal. COT sell signals, on the other hand, are not evaluated as exit signals in the traffic light, since the COT data is not the right indicator for this.
VIX futures structure curve as an indicator
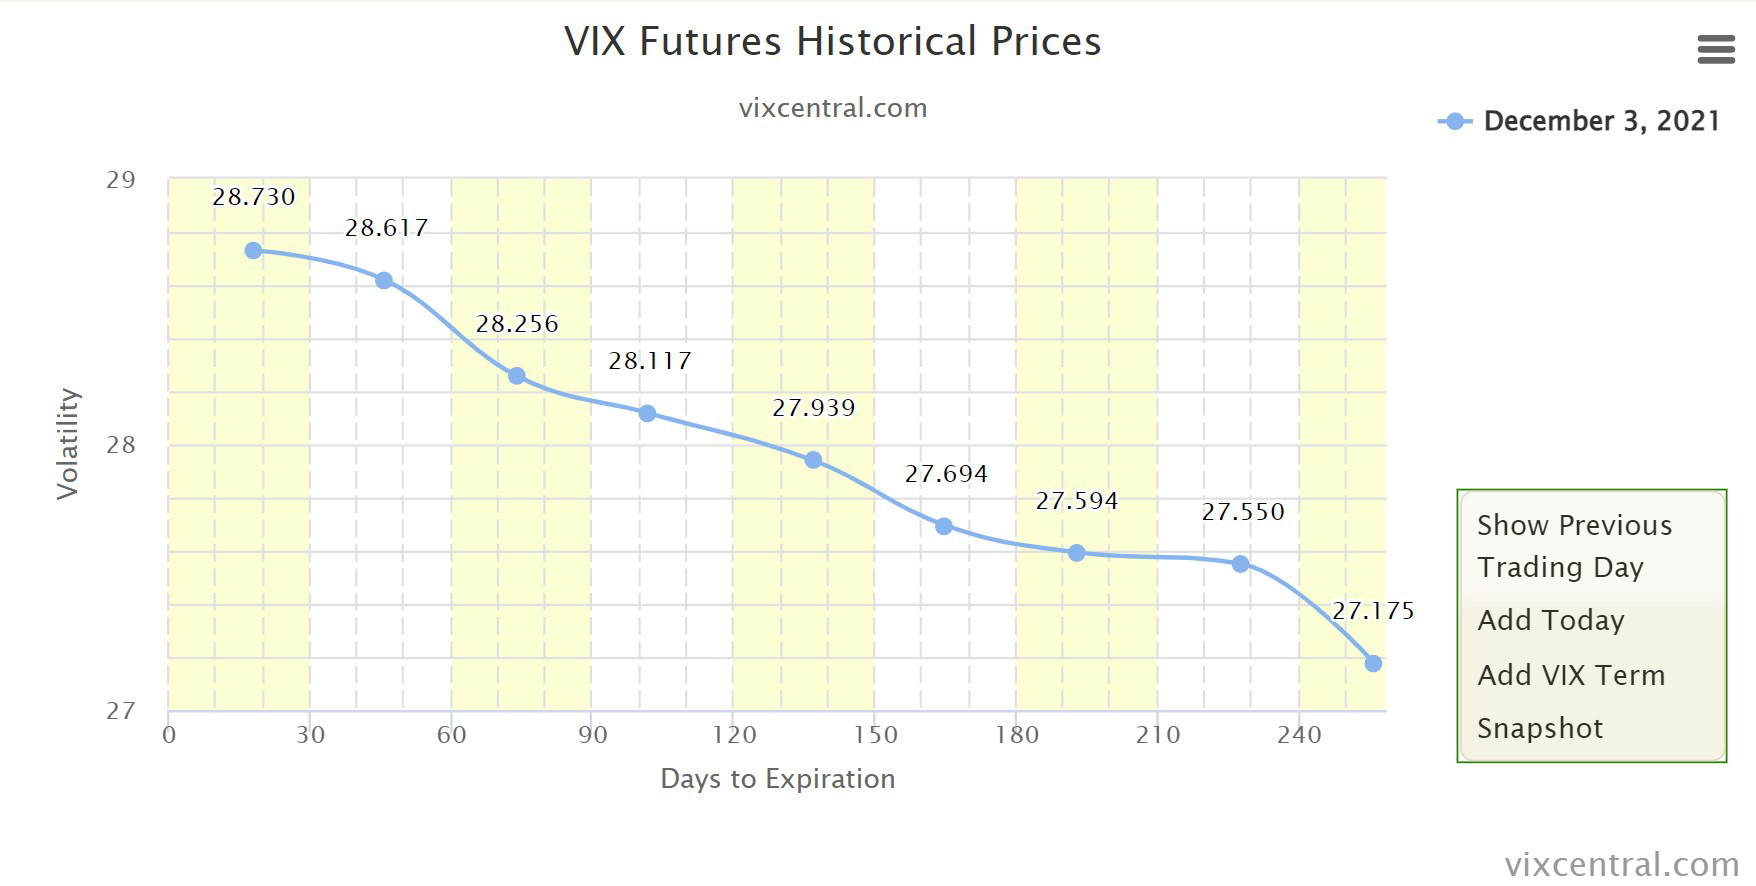
Since March 26, 2007, the VIX Central website has published the futures structure curve of the VIX Futures. This data can also be used as a crash indicator or early warning system.
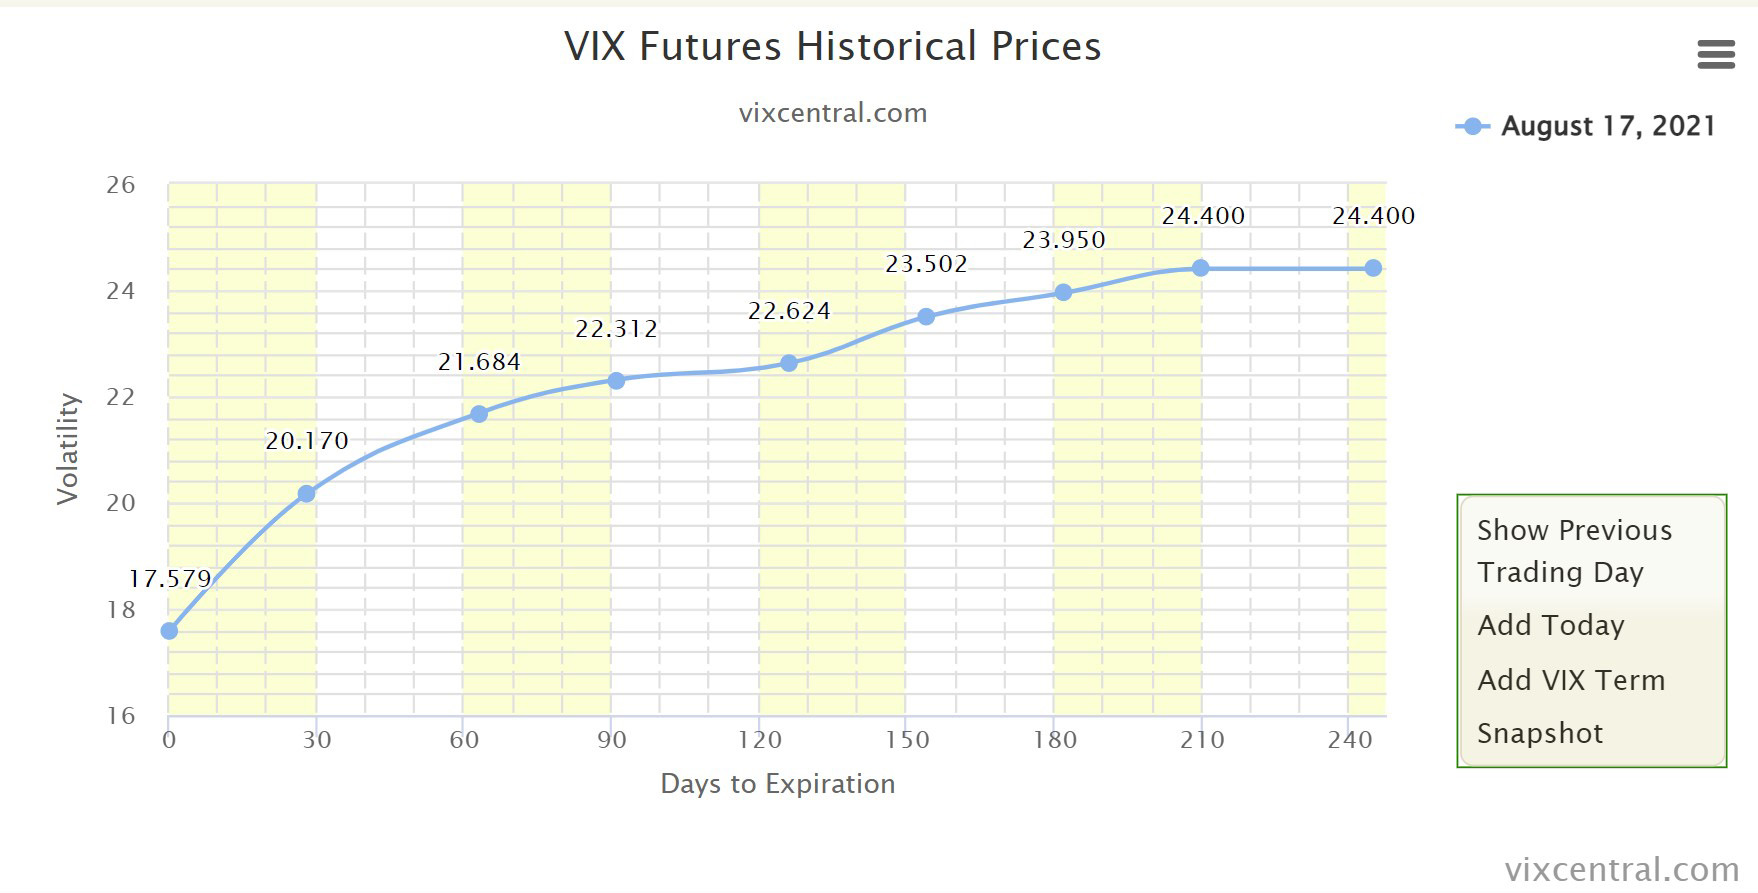
Between January 28th, 2021 and December 2nd, 2022, the forward structure curve is in so-called contango. Every futures contract has a higher price with a longer term.
When evaluating the spread, it is good enough for me if the value of the first contract is greater than or equal to the value of the second contract. This is already an abnormal situation and signals an increased need for hedging on the part of the large market participants.
If such a situation occurs, beware! I then hedge the open position tighter with a stop.
The forward curve is suddenly in backwardation for just one day. Although the condition only lasts for a day, it is a warning sign that the major market participants are hedging their positions and a major correction or even crash in the stock markets may soon occur.
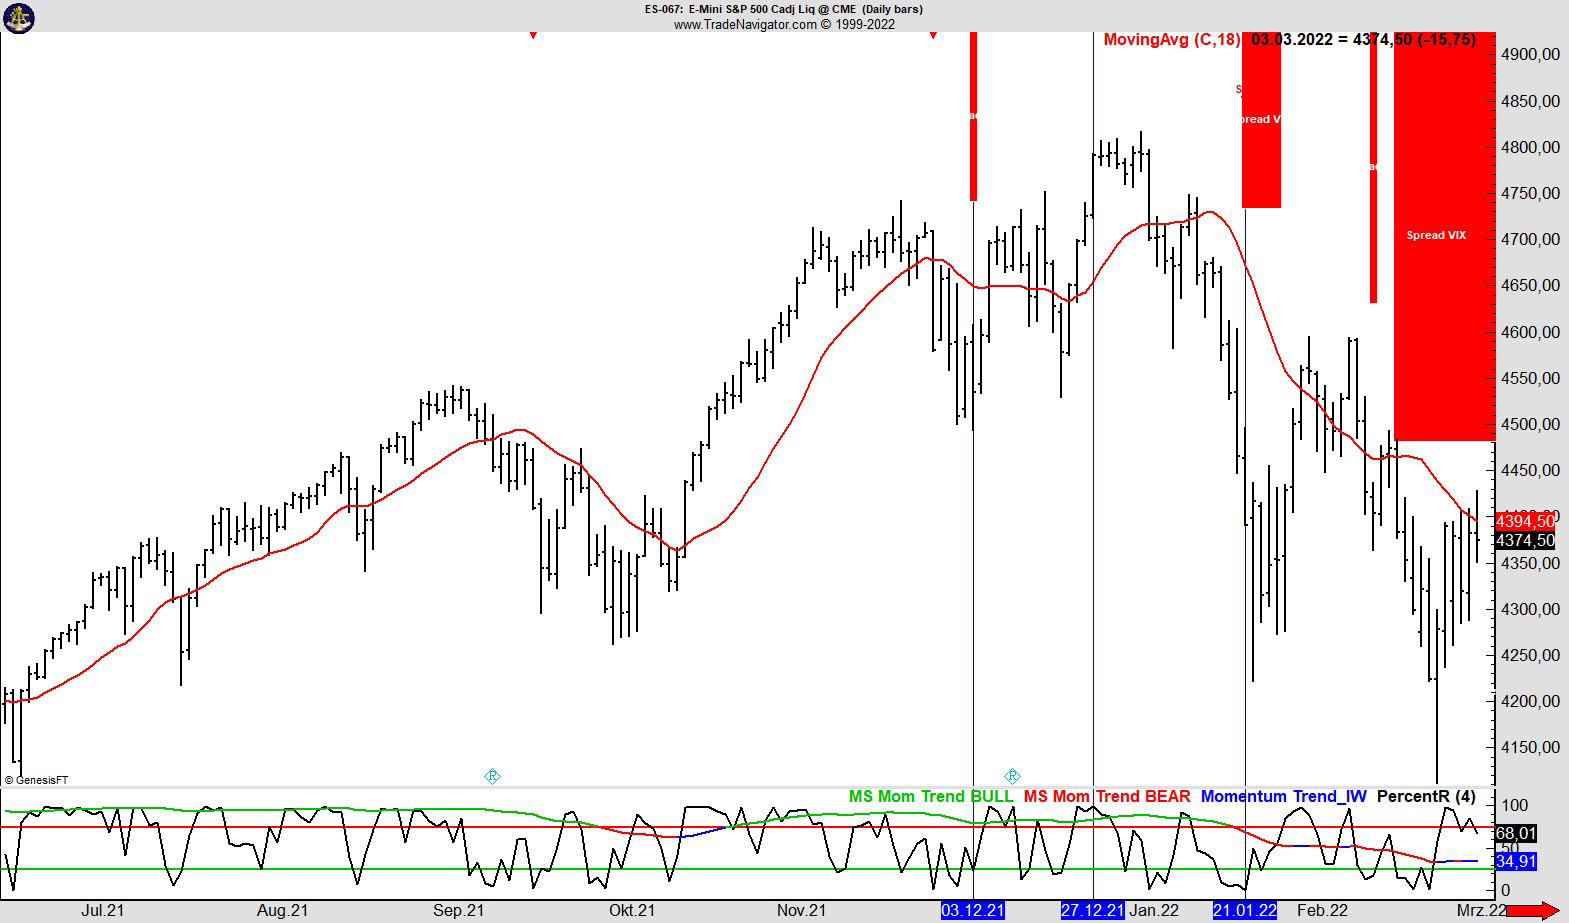
The red bars mark the days with a backwardation of the VIX futures. After the one-day event of backwardation on December 3rd, 2021, the situation seems to normalize in the following weeks, because the S&P 500 makes new all-time highs again from December 27th, 2021. But about 3 weeks later on January 21, 2022, backwardation in the VIX futures occurs again and the bear market of 2022 begins.
POIV Indicator
The POIV indicator (Price Open Interest Volume) was developed by Larry Williams. It is based on the OBV indicator (On Balance Volume) but in addition to the trading volume it also takes into account the open interest and offsets it with the price.
By taking into account fundamentals, open interest, and trading volume, the indicator can show market direction changes even before the price has reacted. This is then reflected in divergences.
Larry Williams published a lengthy article in Futures Magazine in December 2007 explaining the ins and outs of the POIV indicator.
Classic Chart Analysis
52 Moving Average
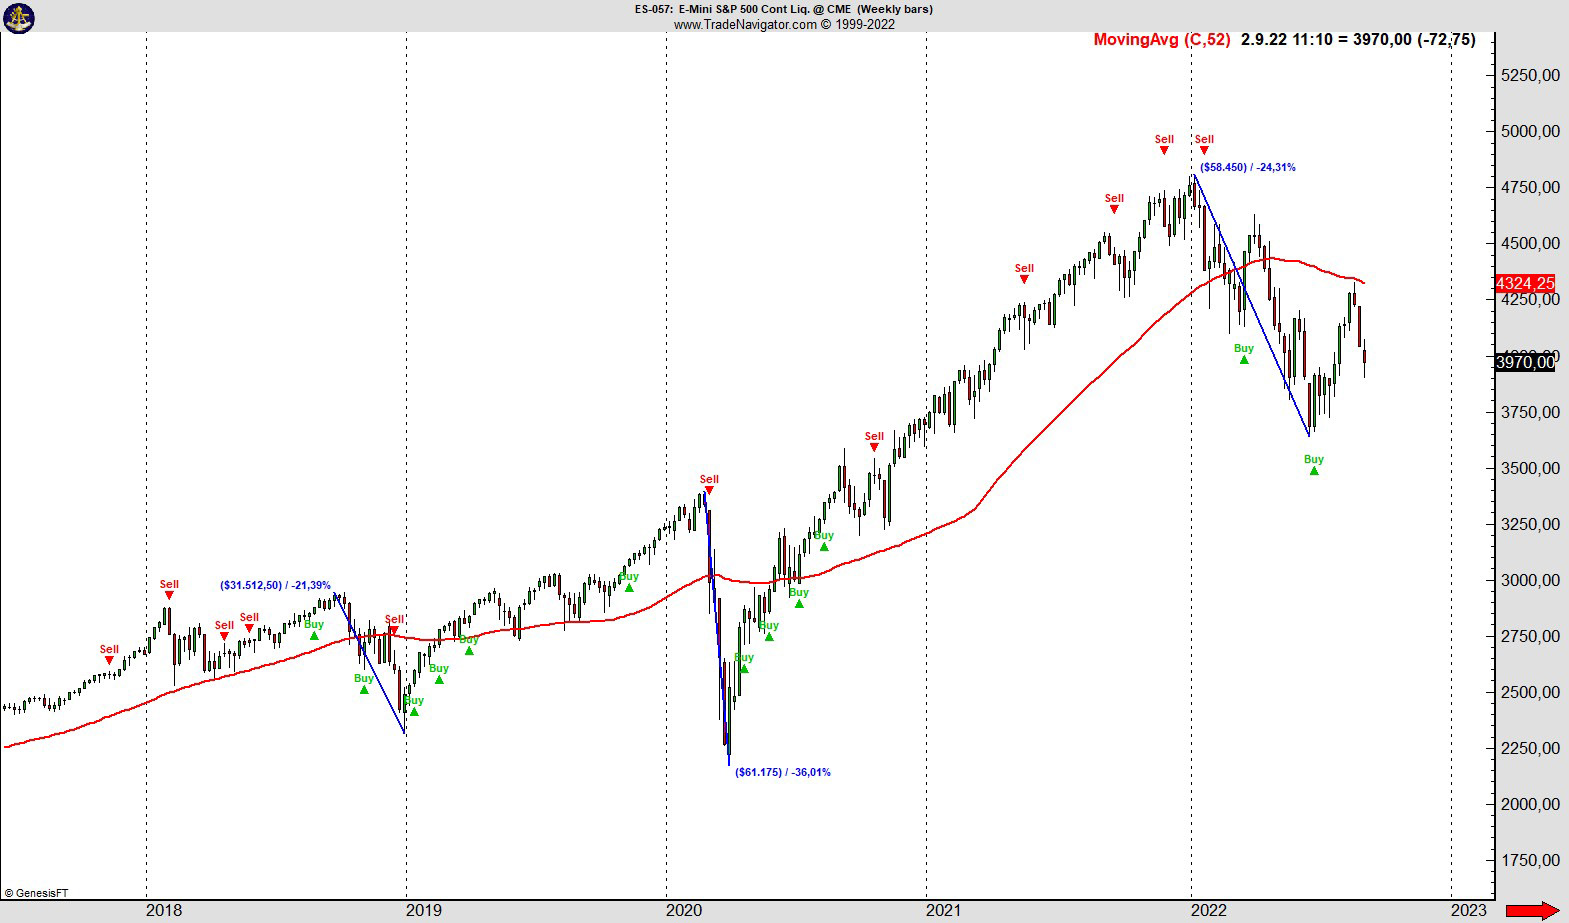
The 52 Moving Average is a trend-following indicator that can be used to gauge the strength of a trend. I look to see if the price is above or below the 52 moving average. I use the 52 moving average because there are 52 weeks in each year.

The graphic shows an excerpt from InsiderWeek's COT tool using the example of the S&P 500 index in the weekly chart. You can see that the two rallies in 2019 and 2020 were well indicated by the COT buy signal. COT sell signals, on the other hand, are not evaluated as exit signals in the traffic light, since the COT data is not the right indicator for this.
You can see in the chart above that this stock market traffic light indicator has also shown the last stock market crashes to some extent. Above all, I use this indicator to visualize the trend strength in rally phases.
Trend analysis
The trend is analyzed on a weekly and daily basis and also serves to classify the market. With the trend you can classify the health, strength, or weakness of the market. I analyze the trend towards market technology as described in many technical analysis books.
Momentum Indicator
There are entire trading strategies that only focus on momentum. In the inloopo stock exchange traffic light, I use the momentum indicator to also assess the state of the market and whether there is positive momentum.
You can only increase your money with the S&P 500 strategy if there is positive momentum. I use a momentum indicator based on Larry Williams' PercentR (%R) indicator.
Divergence
I analyze divergence to find the right time to enter the market. Also,as a further confirmation in conjunction with the COT buy signal after a crash or longer falling market phases, a so-called bear market.
As a basis for my divergence analysis, I use three indicators, the ProGo indicator and POIV indicator by Larry Williams and a divergence based on momentum, and compare them to the current price.
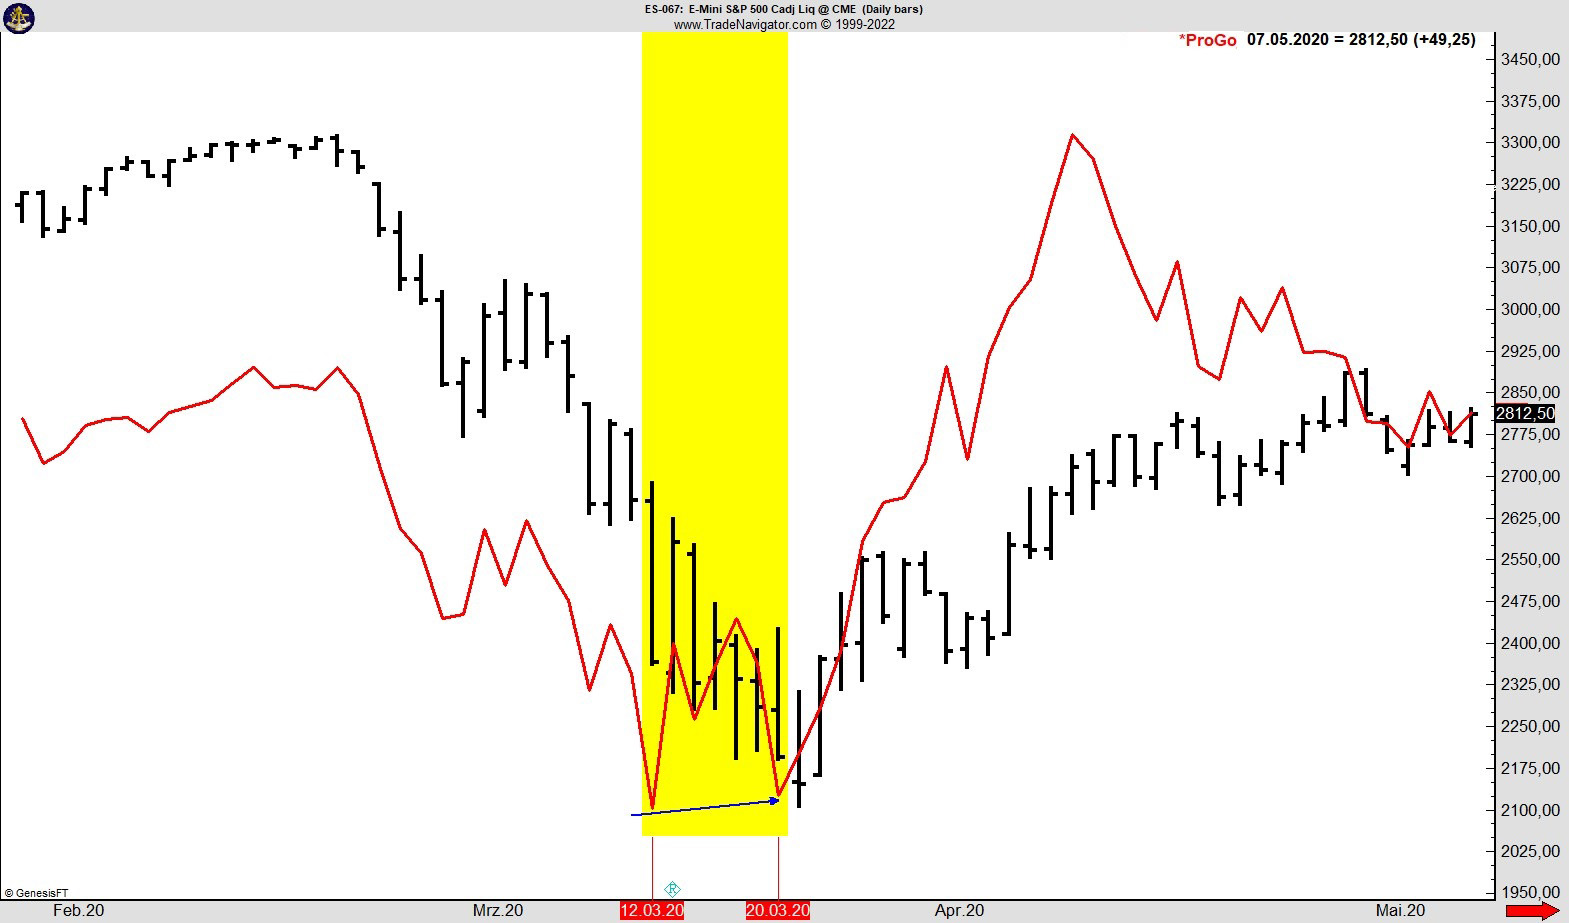
The ProGo indicator (red line) has formed a divergence on the price (black daily candles). On March 12th, 2020 the ProGo indicator recorded its lowest low. The next low of the ProGo indicator on 03/20/2020 is higher than the previous one, unlike the course of the S&P 500, which was at its lowest low on March 20th, 2020. Thus, the indicator rose ahead of the course and reliably indicated the subsequent trend change.
All three indicators are equally weighted and there must be only one divergence in case of a signal.
I only use divergence analysis when the stock market light is red to provide further confirmation of timing and re-entering the market. Once a position has been opened I no longer look at the divergence but analyze the spreads on the VIX futures to time the exit.
Are there false signals?
Yes, every system has false signals, because there is never a 100% probability in the financial markets.
There are clear entry and exit rules depending on the stock exchange traffic light situation. These rules serve to limit the risk of false signals.
To optimize performance in sideways markets like in 2014, I plan to integrate sentiment analysis and seasonal trends. I also plan to optimize the rules for securing profits.
Summary
If you use the inloopo stock market indicator, you will beat the market in the long term because:
You are invested in phases of rising stock markets.
You are not invested during major market corrections or before a crash (100% cash quota). This is how you protect your capital.
The compound interest effect creates a wonderful outperformance in conjunction to the comparable market.
The system can be implemented by anyone with very little investment of time and it works with any account size.
If you have any further questions or suggestions, please send me an email to info@inloopo.com. I'm looking forward to your response.
PS: An overview of all inloopo stock market traffic light indicators is available under this sentence.