
They are generalized.
They are compared with each other. Although they are as different as a mouse and an elephant.
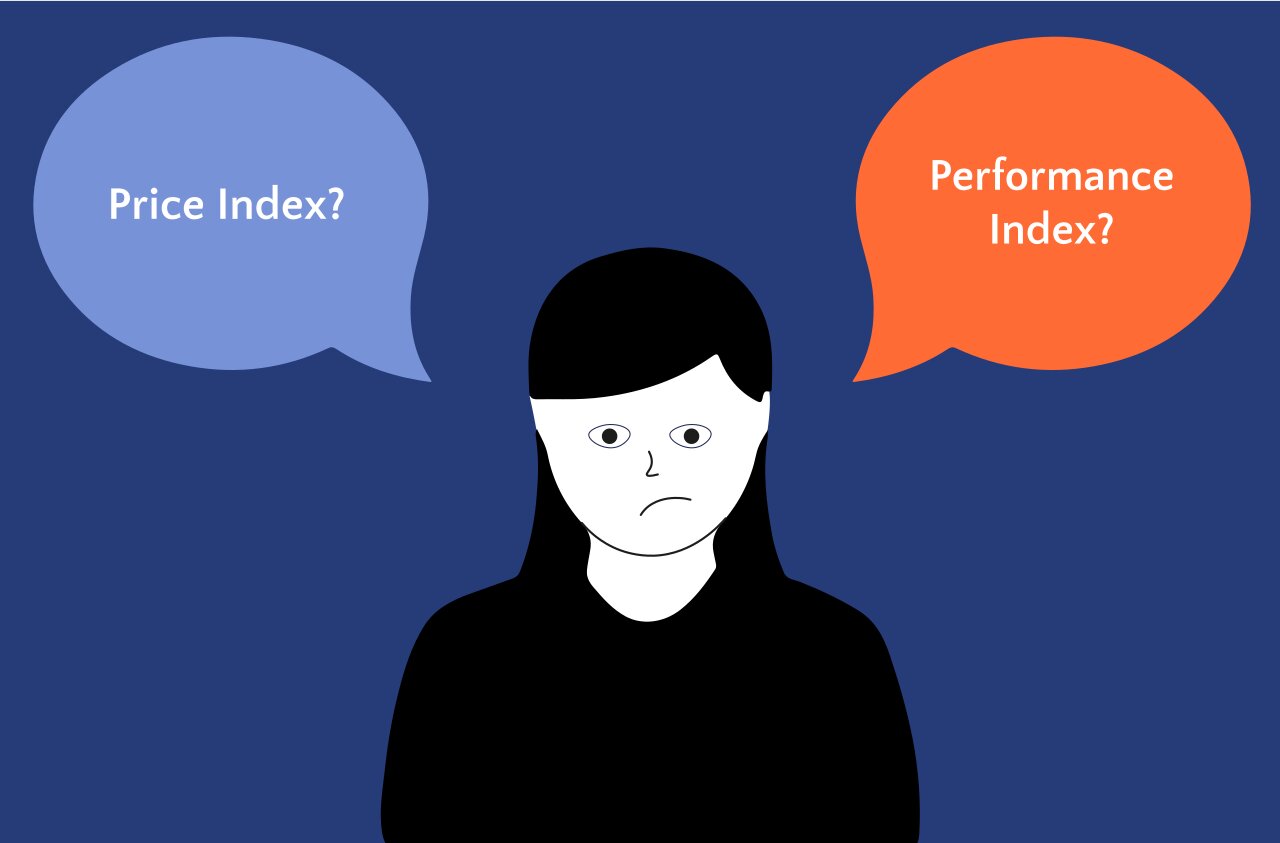
The Performance Index and the Price Index.
Which index type would you choose for your dream ETF?
You can find out here.
What is a Price Index?
A Price Index only takes into account the price changes of the companies it contains. Dividend payments or other distributions are not taken into account.
That means:
A Price Index only reflects the price development of share prices. It shows the shares as they are currently on the stock exchange.
An example of a Price Index: Even though all stocks in an index pay an average of 2% dividends per year and the stock price stays the same, the Price Index lingers in the same position as a stature that you can't move.
What is a Performance Index?
A Performance Index (Total Return Index) contains all distributions of the companies included in the index. Dividends, cash capital increases (option rights) or shares in a capital increase from your own funds (“free shares”) are all part of this.
What does that mean?
The Performance Index shows the price development of the shares including the profits that are distributed.
An example of a Performance Index. A stock pays 5% dividends per year, which are reinvested. The Performance Index rises even though the share price does not change.
ETF selection
So, when choosing your ETF, make sure you choose the right index type.
Luckily these days you can hardly find ETFs which are just tracking the Price Index. 99 % of the ETFs do include all dividends and other payments to their performance.
But make sure to check the type of ETF you have already in your portfolio!
Comparison: Performance Index and Price Index
All North American indices (S&P 500, Dow Jones Industrial Average, Nasdaq Composite ...) are displayed as a Price Index. Just like the MSCI World Index.
The German indices DAX, MDAX and SDAX, on the other hand, are presented as a Performance Index.
It's (almost) nowhere.
For example.
The German DAX Index is calculated and displayed as the DAX Performance Index. You can also display it as a course index.
Here is the course of the DAX Performance Index compared to the DAX Price Index.
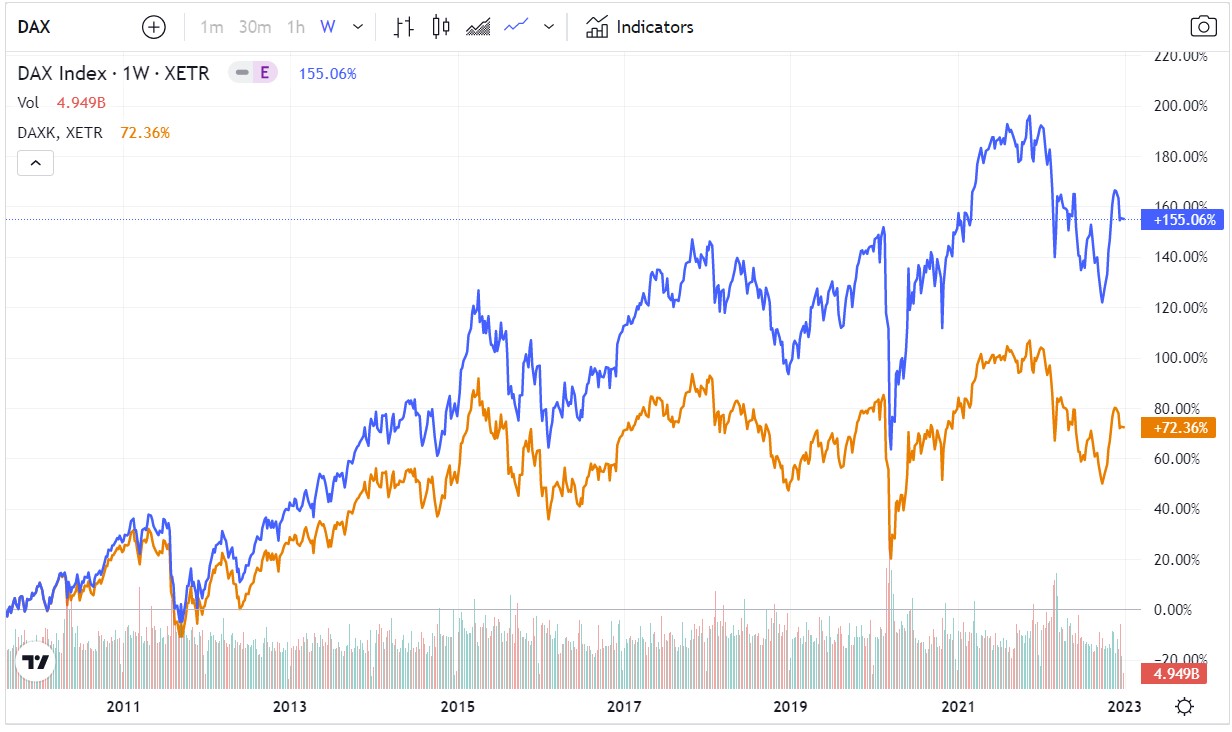
Viewed over a number of years, the differences in overall performance become clearer.
Second example. MSCI World Index.
The MSCI World Index is available in many different variants and currencies. It is calculated every minute by the North American financial services provider MSCI Inc. (formerly Morgan Stanley Capital International).
You will be shown the MSCI World as a Price Index. It is also available as MSCI World Performance Index and MSCI Total Return Net World Index.
With the net return variant, the withholding tax is deducted and is therefore not included in the index price. The index is also calculated in many currencies such as the US dollar, euro, British pound and others.
A third example. EURO STOXX 50.
By default, you see the EURO STOXX 50 Price Index (blue). Compared to the EURO STOXX 50 Performance Index (green), the Price Index is weakening.
](https://images.ctfassets.net/wejpe8yzflc3/4zgeLlH61OKeYyFG2xpLs2/864ef7f457393d32ad0b4ab4dcce9543/euro-stoxx-50-performance-kursindex.jpg)
One last example. Swiss Performance Index (SPI) vs. Swiss Market Index (SMI)
In Switzerland there are two indices on which there are also ETFs. Both are completely different.
The SPI is a Performance Index and contains almost all Swiss stock corporations.
The SMI, on the other hand, only includes the 20 largest Swiss stock corporations and is calculated as a Price Index.
Before you invest in either ETF, compare the total expense ratio (TER). Because of Swiss tax law, not every provider has a cheap ETF in their program. Therefore, there are clear cost differences.
Aside from that.
In the SMI, the three largest companies (Nestlé, Novatis and Roche) account for around 60%. There is a risk of cluster risk or lack of diversification.
Swiss Performance Index (SPI) | Swiss Market Index (SMI) |
|---|---|
Almost all Swiss stocks | 20 largest and most liquid stocks |
Performance Index (incl. dividends) | Price index (excluding dividends) |
Summary
Always choose an ETF that tracks the Performance Index (Total Return Index). Because this gives you a share in the profit distributions of the companies. While the Price Index does not include dividend payments or other profit distributions. Therefore, the Price Index always has a worse performance.
Improve your ETF performance with a working ETF strategy and take a look at my free inloopo stock market indicator.